Anyone traveling through a U.S. airport in the last decade has undoubtedly noticed the increased security presence provided by the Transportation Security Administration (TSA). The searches, pat-downs, and strict screening guidelines may have felt reassuring post-9/11, but has public sentiment changed in the years since our last major terror attack?
In 2014, the TSA screened a total of 653 million airline passengers, many of whom took to Twitter to share their feelings on the process. In order to determine TSA sentiment, we collected thousands of these tweets from January to April 2015 that included @TSA mentions. Related hashtags (e.g., #thankstsa) were also collected and sorted based on their geographical location. Although most of America’s major airports are mentioned throughout the entirety of the study, many airports did not provide enough TSA tweet data for examination and were excluded. Then we ranked the disposition of each tweet as either positive, negative, or neutral by parsing them through a sentiment analysis algorithm, AlchemyAPI, and collected the results.
The following is a look at the valuable insights we gathered, including TSA sentiment by state and airport.
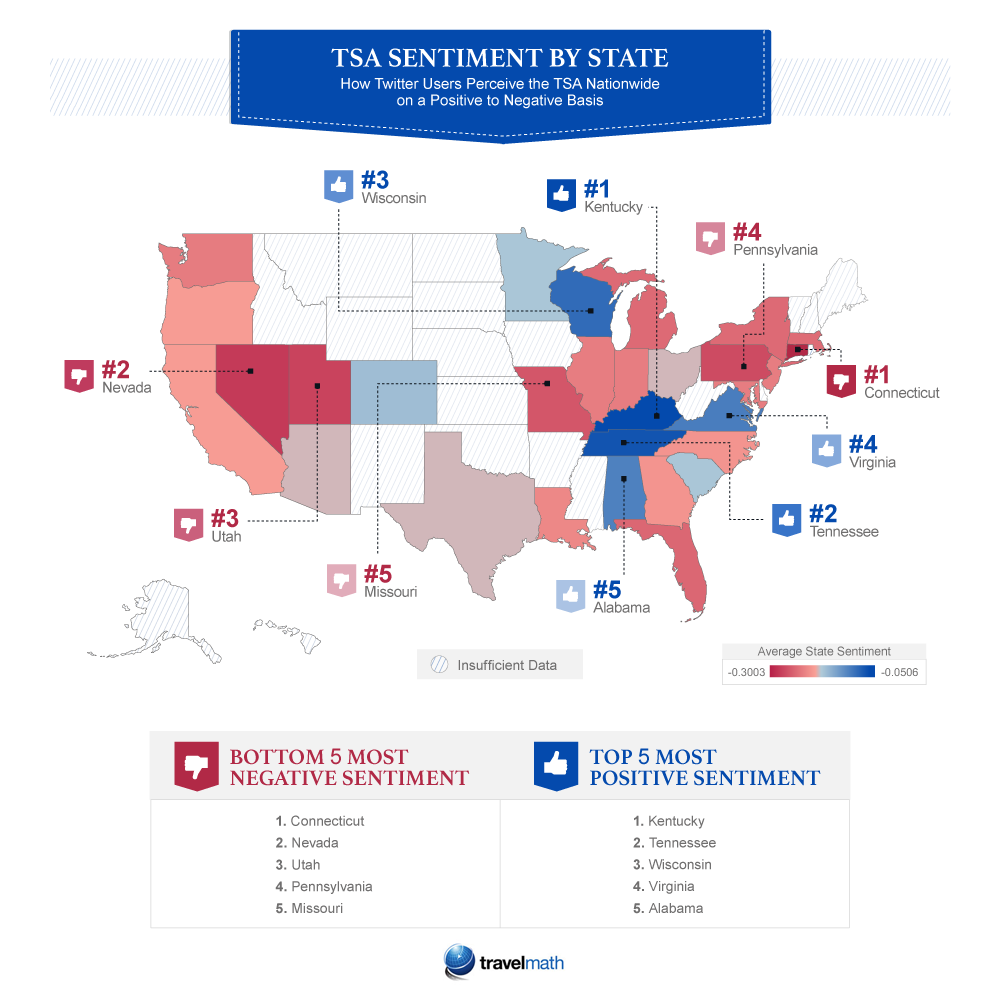
Some states lacked enough data to claim an overall sentiment. For those that did have data, nearly three times as many had a negative sentiment than a positive one. Let’s take a look at some of the state specifics.
Kentucky ranks as the state with the most positive feelings toward the TSA. For example, one user commented:
#TSA in Louisville by far the quickest and friendliest in the world @TSA whatever they are doing they are doing it right.
— Davis Webb (@DavisJWebb) March 24, 2015Tweets from Connecticut – the state with the most negative sentiment – had a far different tone.
Last time I went to the airport, TSA patted me down because I forgot to take my laptop out of my backpack #ItsNotThatSerious
— Andrew Fitzgerald (@A_Fitzzz18) March 13, 2015Nevada, another top negative sentiment state, produced comments such as the following:
Wonder how efficient #TSA would become if they got charged by how much time they made you wait in line?
— Sav Khetan (@savkhetan) January 6, 2015@TSA I watch as one person slowly id's people and two tsa agents stand 10 feet away. Stop being so inefficient and illlgical.
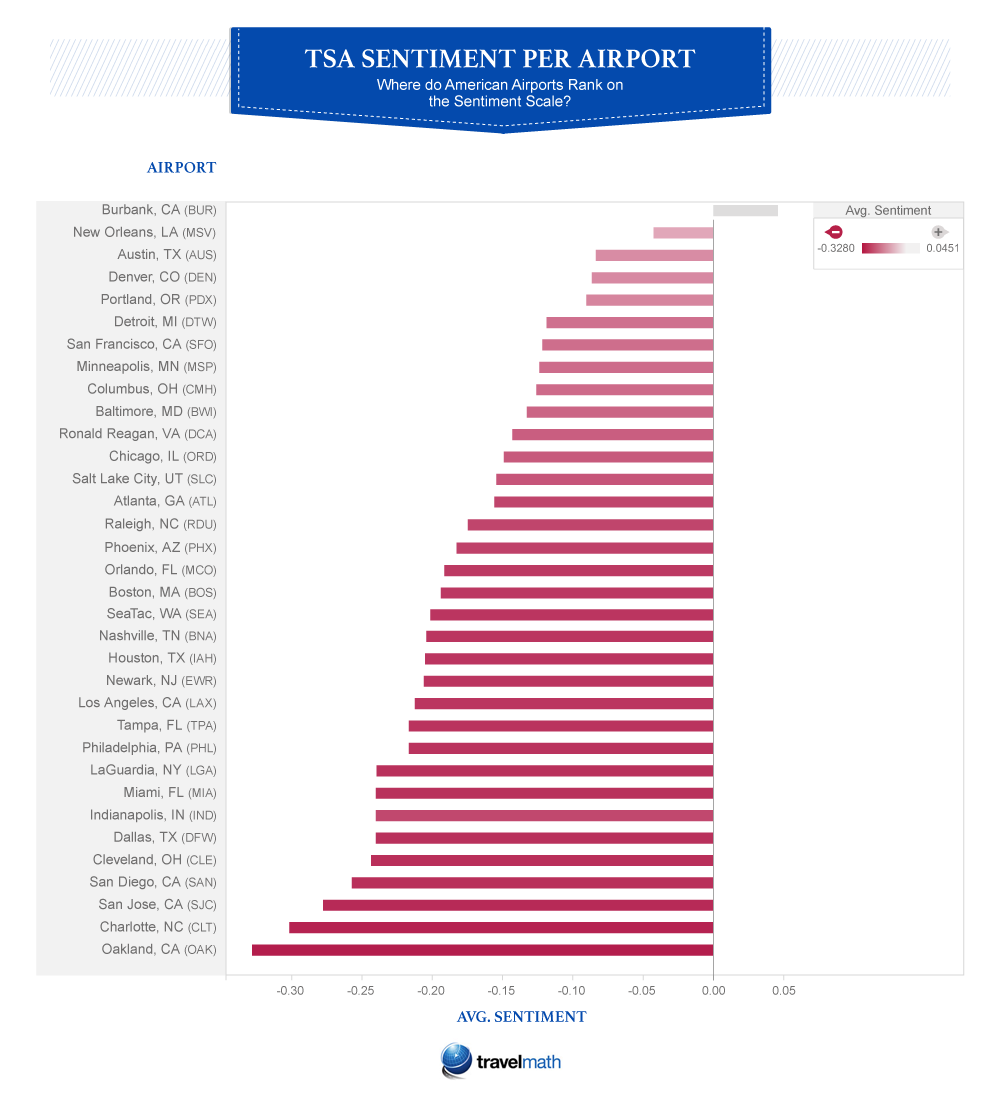
— Anthony Spinella (@holdplz) April 14, 2015In addition to gauging overall sentiment by state, we were curious how things stacked up when comparing airports specifically. In which airports are the TSA most criticized?
While California may be known for its amazing beaches, redwood forests, and breathtaking mountains, it’s also home to four of the top five airports for most negative TSA sentiments. The TSA in Oakland (OAK), Long Beach (LGB), San Jose (SJC), and San Diego (SAN) airports represent a real sore point for travelers.
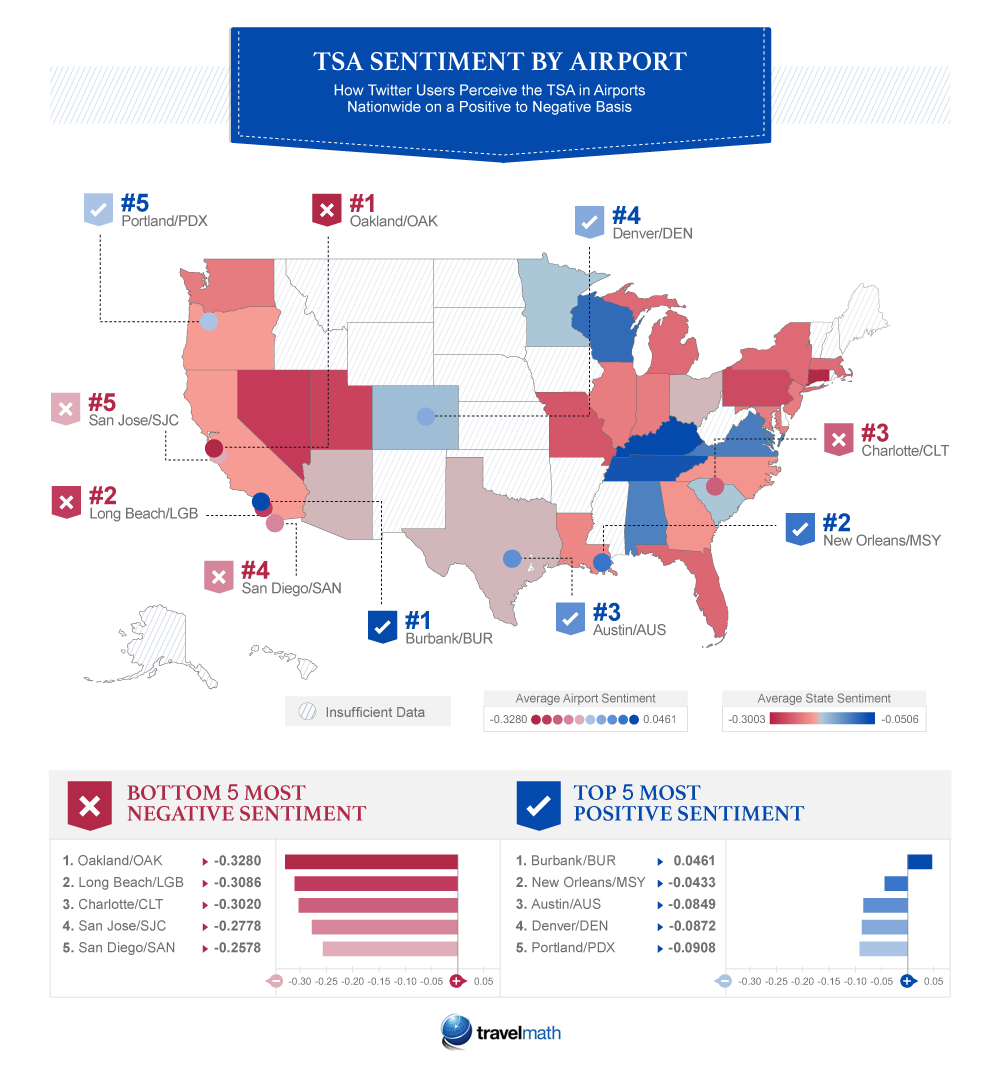
Although it’s not clear why travelers in the Golden State have such negative feelings toward the TSA, it’s interesting to note that Burbank (BUR), also located in California, breaks the negativity trend. It has the most positive sentiment in the nation, followed by New Orleans (MSY), Austin (AUS), Denver (DEN), and Portland (PDX).
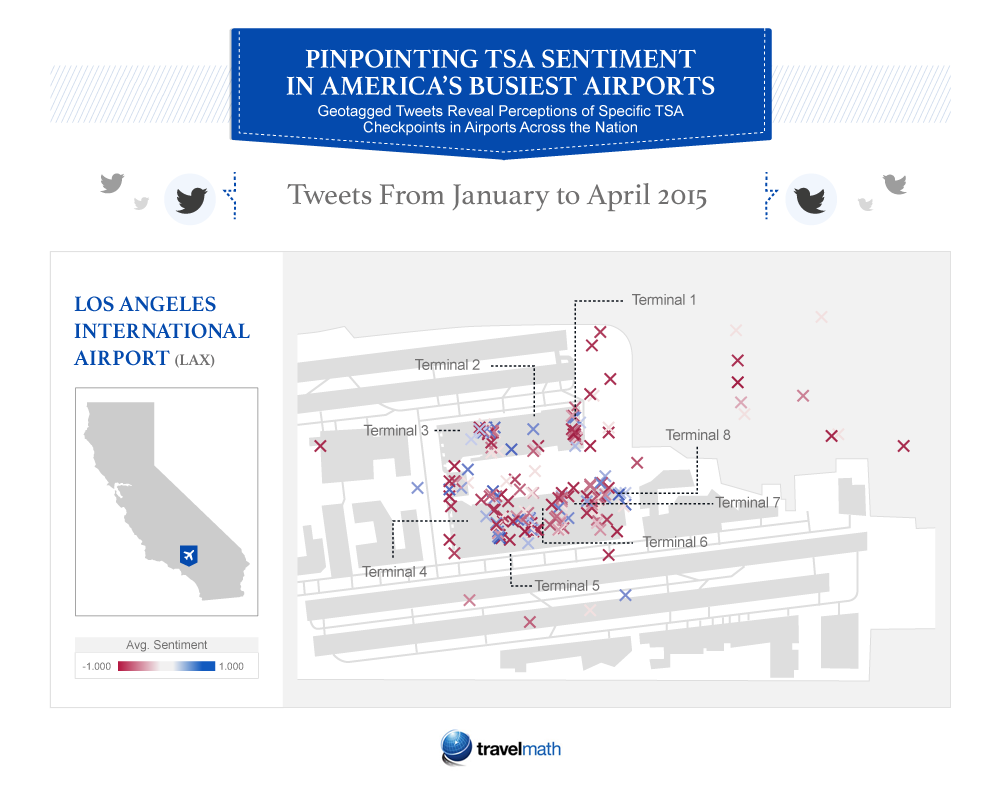
Tweets pulled for this study were geotagged, which allowed us to determine the exact location of any given tweet within its respective terminal. We took the layouts from six popular airports and merged them with the sentiment-ranked Twitter data. Each color-coded X represents a tweet, with the color intensity indicating the strength of the sentiment. It becomes obvious from the visual representation that the strength of negative sentiment tweets outweighs the relatively fewer and less intensely positive tweets. This trend repeats itself time and again, painting a grim picture at each of the airports represented.
Select an airport below:
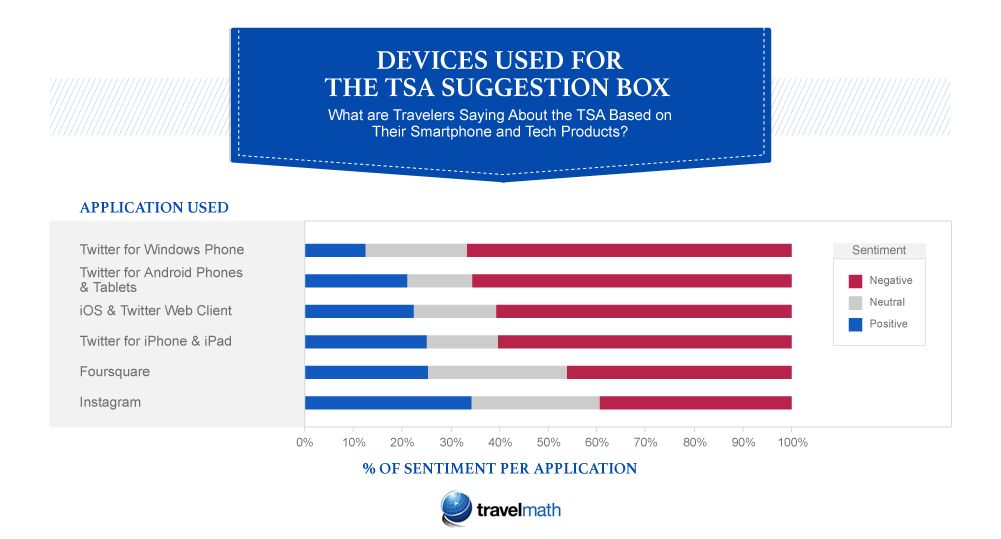
Taking an even closer look at those tweeting about the TSA, patterns emerge about the devices used when compared with sentiment. Windows Phone users were the most negative, followed by Android and then iOS. Those who tweeted via Instagram were more positive than Foursquare-connected users as well.
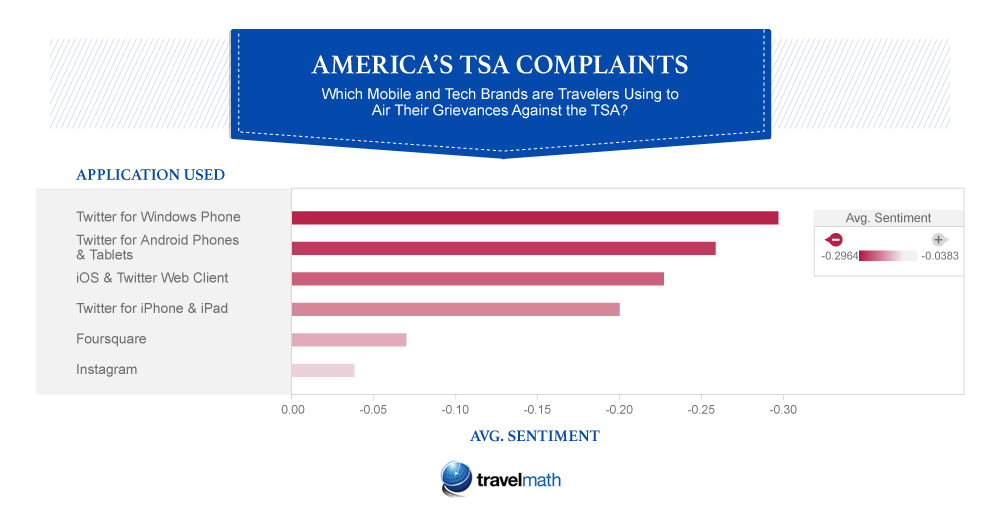
Regardless of the device or platform passengers used to express feelings about their TSA experience, the results were always more negative than positive. In many cases, negative sentiment outweighed its positive counterpart by a factor of two to one.
While almost all the airports fall into the negative TSA sentiment category, some fared worse than others. The poor overall performance of the TSA in California airports is easily visible when the data are presented in such a manner. The lone outlier – Burbank, CA (BUR) – was not only the most positive airport; it was the only positive airport.
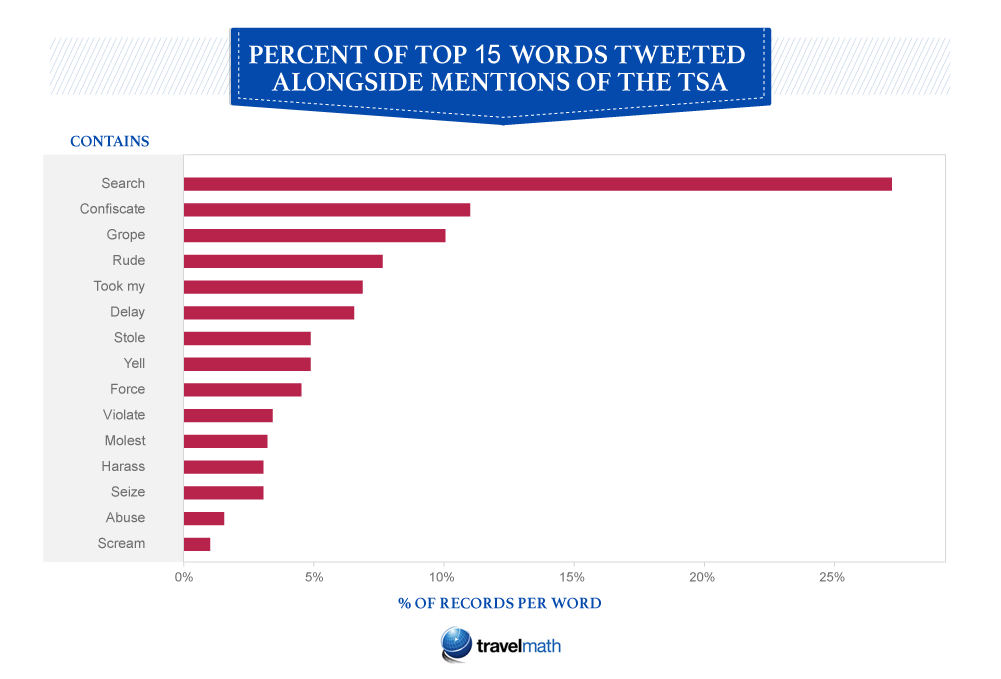
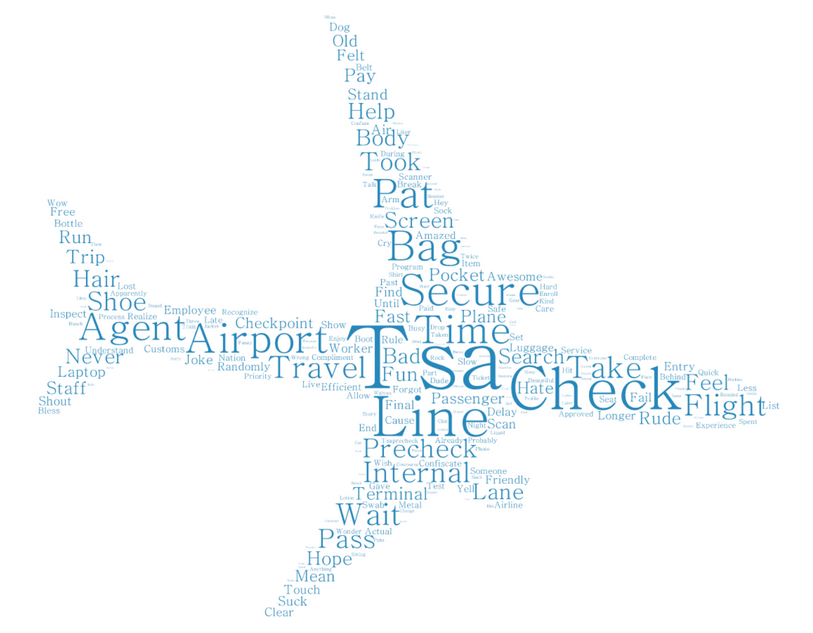
A closer look at the language used in @TSA Twitter mentions highlights some of the main concerns of airline passengers. With words such as “confiscate,” “grope,” “rude,” “violate,” and “molest” making a measurable appearance in @TSA tweets, it’s obvious that passengers are using social media to express their frustrations. Of the top 15 words mentioned, it’s difficult to imagine anything other than “search” being used in a positive manner.
U.S. DOT and TSA Data
The U.S. Department of Transportation (DOT) collects a large volume of data on air travel–related incidents, from airports and airlines. While consumer sentiment toward the TSA does not paint a pretty picture, the U.S. DOT data suggest that security-related incidents are not a significant factor in flight delays. Only .03% of flights are reported to have been delayed by security, which is many times fewer than any other reason. Additionally, the likelihood of an individual filing a complaint for mishandled luggage during a screening procedure is less than one in 20,000 (.00005%).
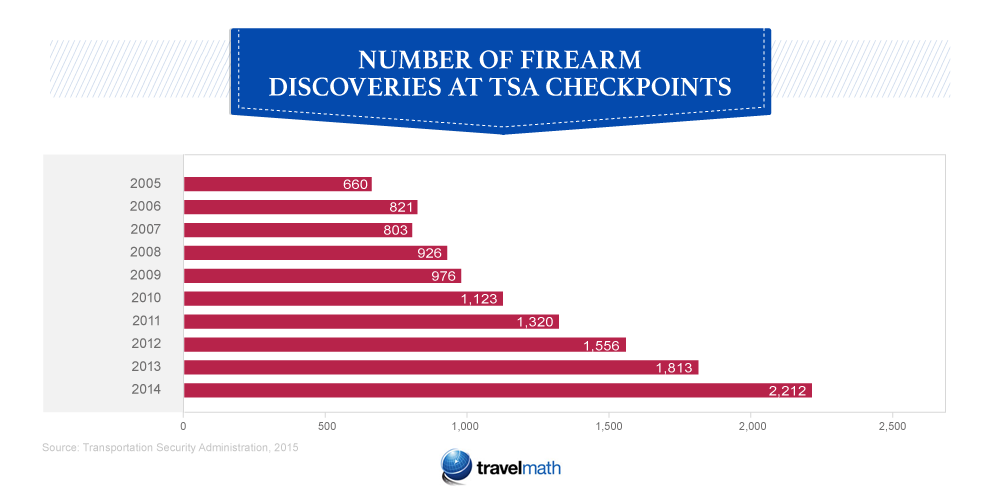
The TSA states that its mission is to “Protect the Nation’s transportation systems to ensure freedom of movement for people and commerce.” Its thorough screening of airline passengers has led to an increasingly startling number of firearms being discovered at TSA checkpoints. Data provided since 2005 show a steady increase in the number of firearms discovered year over year, with a total of 2,212 in 2014 alone – 83% of which were loaded.
Conclusion
Frustrations at the airport are nothing new to any seasoned traveler. Still, there are many variables that can impact customer satisfaction. What isn’t clear is how much of an impact other variables have on a passenger’s perception of the TSA. Could a better overall flying experience reduce the negative sentiment toward the TSA? We may never know, as U.S. airports are markedly absent from a recent report highlighting the 10 best airports in the world.
What is clear, however, is that passengers are extremely vocal when it comes to their opinions on the TSA, regardless of other variables. If someone feels slighted by the TSA, there is a great chance they will make it known to the world. And with such instances so heavily skewed toward the negative, one can’t help but believe there is significant room for improvement. High levels of security and a positive customer experience are not mutually exclusive, but it may be up to the TSA to optimize a blend of these two factors.
Sources
https://blog.tsa.gov/2015/01/tsa-2014-year-in-review.html
https://www.dot.gov/sites/dot.gov/ files/docs/2015MayATCR.pdf
https://www.tsa.gov/about-tsa
http://www.businessinsider.com/worlds-best-airport-awards-2014-3